Electrical Marketing's Leading Indicators

May 20, 2011
AIA Billings Index tumbles almost three points in April Following several months of relatively positive business conditions, the Architecture Billings

AIA Billings Index tumbles almost three points in April

Following several months of relatively positive business conditions, the Architecture Billings Index (ABI) fell almost three points in April. As a leading economic indicator of construction activity, the ABI reflects the approximate nine-to-twelve month lag time between architecture billings and construction spending. The American Institute of Architects (AIA), Washington, D.C., reported the April ABI score was 47.6 points, a decrease from a reading of 50.5 points the previous month. This score reflects a sharp decrease in demand for design services (any score above 50 points indicates an increase in billings). The new projects inquiry index was 55 points, down from a mark of 58.7 points in March, but still at a healthy level.

“The first question is whether this drop is a sign of an industry-wide reversal in demand for design services or a bump in the road,” said AIA Chief Economist Kermit Baker. “The fact that most construction projects funded under the federal stimulus program have completed their design work, the anxiety around the possibility of a shutdown in the federal government in April, as well as the unusually severe weather in the Southeast had something to do with this falloff. However, the majority of firms are reporting at least one stalled project in-house because of the continued difficulty in obtaining financing. That issue continues to be the main roadblock to recovery.”

PMI slips to 60.4 points

Norbert Ore, chair of ISM's Manufacturing Business Survey Committee said, “The New Orders and Production Indexes continue to drive the PMI, as they have both exceeded 60 percent for five consecutive months. Manufacturing employment appears to have developed significant momentum, as the Employment Index readings for the first four months of 2011 are the highest readings in the last 38 years. Inventory growth also took place in April after two months of destocking; however, the inventory restocking would appear to be necessitated by the strong performance in new orders.”

Leading economic indicators still strong

The Conference Board Leading Economic Index (LEI) for the U.S. rose 0.4 percent in March to 114.1 (2004 = 100), following a one-percent increase in February, and a 0.2 percent increase in January, pointing to strengthening business conditions in the near term.

The Marketplace : Key Figures

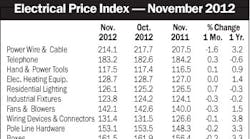
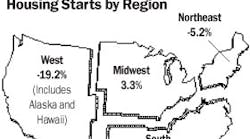
Month Latest month Previous month Month-over-month % change Year ago Year-over-year % change 2010 annual CONSTRUCTION New Construction Put in Place (Billions of dollars, SAAR)2 Offices MAR 22.07 21.76 1.4 26.01 -15.2 24.43 Industrial MAR 32.20 30.53 5.5 45.02 -28.5 38.35 Total MAR 768.90 758.58 1.4 824.02 -6.7 813.34 Housing Starts (Thousands of units, SAAR)2 Single-unit APR 394 415 -5.1 566 -30.4 471 Total APR 523 585 -10.6 687 -23.9 585 Mobile Home Shipments3 (Thousands of units, SAAR) MAR 47 44 6.8 55 -14.5 50 Employment, Construction Workers (Thousands)4 APR 5,385 5,184 3.9 5,420 -0.6 5,526 Employment, Electrical Contractors (Thousands)4 MAR 714.2 714.2 0.0 699.7 2.1 723.2 Hourly Wage, Electrical Contractors4 MAR 25.16 24.99 0.7 25.26 -0.4 25.26 PRODUCTION Industrial Production Index (1967=100)5 APR 93.1 93.1 0.0 88.7 5.0 90.1 Construction Supplies Production Index5 (1977=100-SA) APR 75.1 75.2 -0.1 72.9 3.0 72.7 Employment in Electrical Equipment & Supplies Mfg. Production workers (Thousands)4 MAR 137.5 138.0 -0.4 133.9 2.7 136.3 Weekly hours MAR 42.2 42.8 -1.4 41.5 1.7 42.2 Hourly wage MAR 17.74 17.54 1.1 16.33 8.6 16.51 Electric Power Output Index (1967=100)5 APR 103.3 101.2 2.1 96.7 6.9 100.6 Machine Tool Orders* (Millions of dollars)6 MAR 476.47 299.00 59.4 225.81 111.0 NA Industrial Capacity Utilization (Percent, SA)1 APR 74.86 75.27 -0.4 70.87 4.0 71.86 TRADE Electrical Mfrs' Shipments MAR 3,786 3,495 8.3 3,295 14.9 NA Electrical Mfrs' Inventories (Millions of dollars, SA)2 MAR 4,766 4,820 -1.1 4,464 6.8 4,713 Electrical Mfrs' Inventory-to-Shipments Ratio MAR 1.259 1.379 -8.7 1.355 -7.1 1.364 Electrical Mfrs' New Orders (Millions of dollars, SA)2 MAR 4,119 3,628 13.5 3,656 12.7 NA Electrical Mfrs' Unfilled Orders (Millions of dollars, SA)2 MAR 14,160 13,827 2.4 11,699 21.0 12,156 Exports, Electrical Machinery (f.a.s. value in millions of dollars)2 MAR 6,964.0 5,959.0 16.9 6,753.0 3.1 76,736.0 U.S. Dollar vs. Other Major Currencies (1973=100)5 APR 95.5 97.1 -1.6 101.8 -6.1 102.1 PRICES & INTEREST RATES Industrial Commodities Wholesale Price Index (Bureau of Labor Statistics, 1967=100) APR 203.9 200.1 1.9 187.0 9.0 187.0 Electrical Price Index (Electrical Marketing, 1997=100) APR 142.1 141.7 0.3 139.3 2.0 138.9 Construction Materials Wholesale Price Index (Bureau of Labor Statistics, 1982=100) APR 211.9 210.8 0.5 206.1 2.8 205.7 Copper Prices (Metals Week, cents per pound) MAY 407.15 434.44 -6.3 314.58 29.4 346.47 Prime Rate5 APR 3.3 3.3 0.0 3.3 0.0 3.3 Federal Funds Rate5 APR 0.1 0.1 0.0 0.2 -0.1 0.2 Mortgage Rate7 APR 4.8 4.8 0.0 5.1 -0.3 4.7 *Several series related to employment are now being reported on a NAICS basis. Because of this change, some numbers are not directly comparable to previously reported data, but are consistent in year-over-year comparisons and comparisons shown in the table.

Sources: 1McGraw-Hill Construction/Dodge; 2Dept. of Commerce; 3Manufactured Housing Institute; 4Dept. of Labor; 5Federal Reserve Board; 6The Association for Manufacturing Technology; 7Federal Home Loan Bank Board.

Note: Some figures shown — prime rate, for example — are averaged for month. NYA — not yet available

SA-seasonally adjusted. SAAR-seasonally adjusted annual rate. Source for chart: Global Insight.

For further information about construction starts, please contact Dodge Analytics at 1-800-591-4462