Texas Leads Nation in Oil & Gas Production with Big Increase in Permian Basin Drilling and Solid Increase in Eagle-Ford Basin
When the revolution in oil fracking technology supercharged the oil & gas industries in states like North Dakota, Pennsylvania and Ohio several years ago, it was perhaps too easy to look past what historically has been the nation’s leader in oil & gas.
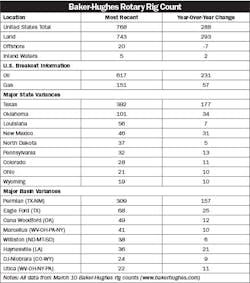
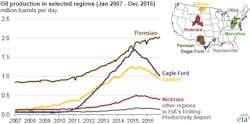
No more. While the Williston Basin in North Dakota’s Bakken region and the Marcellus Shale region of Pennsylvania, Ohio, New York and West Virginia have been slow to recover from decline in the oil & gas industry due to overcapacity and low oil & gas prices, Texas has bounced back strong and enjoyed a surge in drilling activity over the past year, particularly in the Permian and Eagle Ford Basins. These two regions in south and west Texas now account for 68% of all oil production and 25% of natural gas drilling in the United States. At 39%, the Marcellus shale region remains the leader in natural gas production.
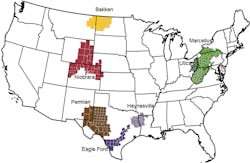
Oil & gas is a very regional business, and the seven regions shown in the charts on this page and on the EIA map above accounted for 92% of domestic oil production growth and all domestic natural gas production growth during 2011-14. But over the years, none of these other regions have quite compared to the Permian Basin in west Texas in terms of production, or apparently in future potential.
According to a recent IHS Markit press release promoting its new report on the oil & gas industry, Super Basins: The Basins that Keep on Giving, the famed Permian Basin is one of 24 worldwide “super basins,” that have a unique geological structure with “multiple reservoirs and source rocks, diverse play types across numerous geologic horizons, infrastructure with access to markets, and established service sector and supply chains.”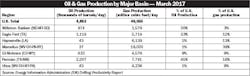
The report called the Permian “America’s model super basin,” and said, “IHS Markit analyzed the Permian Basin and looked at the current view of the estimated ultimate recoverable resources (EUR) for the basin, and compared that with the view of the EUR in 2000, 10 years before the shale boom in the Permian began. Before the horizontal drilling and fracture completion boom, the EUR for the Permian Basin was 35 billion barrels of oil. Remarkably, the current view is 104 billion barrels, almost three times the previous estimate — and some put the number higher.”