Electrical Marketing's Leading Indicators

Dec. 23, 2010
PMI dips but still strong Even though the Purchasing Managers Index lost 0.3 percent, it still remains in growth territory. Said Norbert Ore, chair of

PMI dips but still strong

Even though the Purchasing Managers Index lost 0.3 percent, it still remains in growth territory. Said Norbert Ore, chair of the Institute for the Tempe, Ariz.-based Supply Management Manufacturing Business Survey Committee, “The manufacturing sector grew during November, with both new orders and production continuing to expand. With the PMI at 56.6 percent, November's rate of growth is the second fastest in the last six months.”

Leading Economic Indicators rise again

The Conference Board's Leading Economic Index (LEI) for the U.S. increased 1.1 percent in November to 112.4 (2004=100), following a 0.4 percent increase in October, and a 0.6 percent increase in September.

Said Ataman Ozyildirim, an economist at The Conference Board, “November's sharp increase in the LEI, the fifth consecutive gain, is an early sign the expansion is gaining momentum and spreading. Nearly all components rose in November.” Added Ken Goldstein, another economist at The Conference Board, “Overall the indicators point to a mild pickup after a slow winter. Looking further out, possible clouds on the medium-term horizon include weaknesses in housing and employment.”

Architectural Billings Index (ABI) increases in November

Revenue at U.S. architecture firms increased in November, only the second monthly increase in billings since early 2008, according to the American Institute of Architects (AIA), Washington, D.C. At 52 points, the AIA's Architecture Billings Index (ABI) recorded a three-point gain from the previous month and reached its strongest level since December 2007. With ABI scores above the 50 level in two of the past three months, the prospects of a sustainable recovery in design activity are enhanced.

Kermit Baker, AIA's chief economist, said trends in billings by construction sector were more mixed. On the negative side, the billings index for commercial/industrial firms dipped below 50 points for the first time since last April. On the positive side, residential architecture firms report a solid increase in billings, with the index for that sector increasing to 54.3 points, its highest reading since mid-2007.

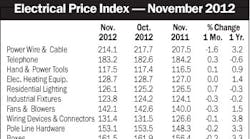
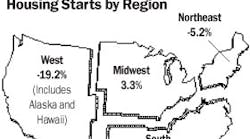
The Marketplace : Key FiguresMonth Latest month Previous month Month- over-month % change Year ago Year- over-year % change 2009 annual CONSTRUCTION New Construction Put in Place (Billions of dollars, SAAR)2 Total OCT 802.32 797.09 0.7 884.65 -9.3 907.63 Offices OCT 22.35 23.72 -5.8 32.85 -32 38.05 Industrial OCT 33.88 35.98 -5.8 54.5 -37.8 58.15 Housing Starts NOV 555 534 3.9 589 -5.8 554 Single-unit NOV 465 435 6.9 504 -7.7 442 Mobile Homes OCT 43 47 -8.5 48 -10.4 50 Employment, Construction NOV 5,752 5,847 -1.6 5,868 -2 6,037 Employment, electrical OCT 767.7 762.2 0.7 781.2 -1.7 795.8 Hourly Wage OCT 25.69 25.28 1.6 24.87 3.3 24.76 PRODUCTION Industrial Production Index (1967=100)5 NOV 93.9 93.5 0.4 89.1 5.4 87.7 Construction Supplies Production Index5 NOV 79.8 79.1 0.9 75.3 6 75.4 Employment, in Electrical Equipment & Supplies Mfg Production Workers (Thousands)4 OCT 144.4 144.5 -0.1 144.1 0.2 146.7 Weekly Hours OCT 43.3 42.2 2.6 40.5 6.9 39.6 Hourly Wage OCT 16.82 16.42 2.4 16.19 3.9 16.11 Electrical Power Output Index (1967=100)5 NOV 97.1 95.8 1.3 95.9 1.3 96.8 Machine Tool Orders* (Millions of dollars)2 OCT 369.94 361.6 2.3 132.61 179 Industrial Capacity Utilization (Percent, SA)1 NOV 73.19 72.95 0.2 68.91 4.3 67.04 TRADE Elec. Mfr. Shipments (Millions of dollars)2 OCT 3,204 3,239 -1.1 2,770 15.7 Elec. Mfr. Inventories (Millions of dollars)2 OCT 4,869 4,828 0.8 4,147 17.4 4,475 Elec. Mfr. I/S Ratio OCT 1.52 1.491 2 1.497 1.5 1.596 Elec. Mfr. New Orders (Millions of dollars)2 OCT 3,296 3,331 -1.1 2,785 18.3 Elec. Mfr. Unfilled Orders (Millions of dollars)2 OCT 15,871 15,779 0.6 13,901 14.2 14,253 Exports, Electrical Machinery (f.a.s. millions of dollars)2 OCT 6,780.00 6,588.00 2.9 6,128.00 10.6 63,949.00 U.S. Dollar vs. Other Major Currencies (1973=100)5 NOV 99.2 98.9 0.3 100.5 -1.2 105.6 PRICES & INTEREST RATES Industrial Commodites Wholesale Price Index (Bureau of Labor Statistics, 1967=100) NOV 189.7 188.7 0.5 180.1 5.3 174.9 Electrical Price Index (Electrical Marketing, 1997=100) NOV 141.9 140.3 1.2 135.7 4.6 133.1 Construction Materials Wholesale Price Index (Bureau of Labor Statistics, 1982=100) NOV 206.1 205.8 0.1 201.7 2.2 202.9 Copper Price (Metals Week, cents per pound) DEC 411.04 388.21 5.9 322.77 27.3 239.28 Prime Rate5 NOV 3.3 3.3 0 3.3 0 3.3 Federal Funds Rate5 NOV 0.2 0.2 0 0.1 0.1 0.2 Mortgage Rate7 NOV 4.3 4.2 0.1 4.9 -0.6 5 *Several series related to employment are now being reported on a NAICS basis. Because of this change, some numbers are not directly comparable to previously reported data, but are consistent in year-over-year comparisons and comparisons shown in the table.

Sources: 1McGraw-Hill Construction/Dodge; 2Dept. of Commerce; 3Manufactured Housing Institute; 4Dept. of Labor; 5Federal Reserve Board; 6The Association for Manufacturing Technology; 7Federal Home Loan Bank Board.

Note: Some figures shown — prime rate, for example — are averaged for month. NYA — not yet available SA-seasonally adjusted. SAAR-seasonally adjusted annual rate. Source for chart: Global Insight.

For further information about construction starts, please contact Dodge Analytics at 1-800-591-4462