Latest from Mag
People - Dec 21, 2012
Obituaries - Dec 21, 2012
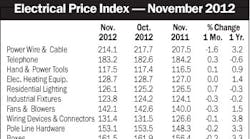
November EPI Index Shows No Change
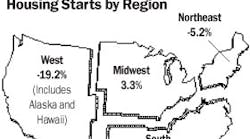
Housing Starts Dip 4% in November
Electrical Marketing - December 21, 2012
Around the Industry - Dec 21, 2012
AIA Index drops again
Following a drop of almost a full point in June, the Architecture Billings Index (ABI) fell again by more than a point in July. As a leading economic indicator of construction activity, the ABI reflects the approximate nine-to-twelve month lag time between architecture billings and construction spending. The American Institute of Architects (AIA), Washington, D.C., reported the July ABI score was 45.1 points — the steepest decline in billings since February 2010. This score reflects a continued decrease in demand for design services (any score above 50 points indicates an increase in billings).
“Business conditions for architecture firms have turned down sharply,” said AIA Chief Economist, Kermit Baker. “Late last year and in the first couple of months of this year there was a sense that we were slowly pulling out of the downturn, but now the concern is that we haven't yet reached the bottom of the cycle. Current high levels of uncertainly in the economy don't point to an immediate turnaround.”
PMI slides 4.4 points
The Purchasing Managers Index (PMI) dropped 4.4 points in July but is still in growth territory, according to the Institute for Supply Management (ISM), Tempe, Ariz. Bradley Holcomb, chair of the ISM's Manufacturing Business Survey Committee, said while the PMI still indicates growth in the industrial market, it appears conditions may be softening.
Leading Indicators up a smidge
The Conference Board Leading Economic Index (LEI) for the U.S. increased 0.5 percent in July to 115.8, following a 0.3 percent increase in June, and a 0.7 percent increase in May. The largest positive contributions came from money supply, the interest rate spread, and average weekly initial claims for unemployment insurance. Said Ataman Ozyildirim, an economist at The Conference Board, “The U.S. LEI continued to increase in July. However, with the exception of the money supply and interest rate components, other leading indicators show greater weakness — consistent with increasing concerns about the health of the economic expansion. Despite rising volatility, the leading indicators still suggest economic activity should be slowly expanding through the end of the year.”
The Marketplace: Key Figures
*Several series related to employment are now being reported on a NAICS basis. Because of this change, some numbers are not directly comparable to previously reported data, but are consistent in year-over-year comparisons and comparisons shown in the table.
Sources: 1McGraw-Hill Construction/Dodge; 2Dept. of Commerce; 3Manufactured Housing Institute; 4Dept. of Labor; 5Federal Reserve Board; 6The Association for Manufacturing Technology; 7Federal Home Loan Bank Board.
Note: Some figures shown — prime rate, for example — are averaged for month. NYA — not yet available
SA-seasonally adjusted. SAAR-seasonally adjusted annual rate. Source for chart: Global Insight.
For further information about construction starts, please contact Dodge Analytics at 1-800-591-4462

