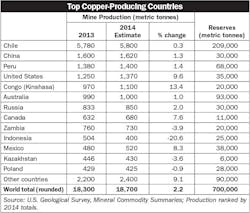
A recently released report by the U.S. Geological Survey Department on 2014 global copper mine production, “U.S. Geological Survey, Mineral Commodity Summaries,” contained some interesting nuggets on the state of the copper mining industry and offered insight into where the most copper is being produced around the world. Following are some excerpts from that report.
In 2014, U.S. mine production of copper increased by 10% to about 1.37 million tons and was valued at about $9.7 billion. Arizona, Utah, New Mexico, Nevada, and Montana — in descending order of production — accounted for more than 99% of domestic mine production; copper also was recovered in Idaho and Missouri. Twenty-seven mines recovered copper, 17 of which accounted for about 99% of production. Copper and copper alloys products were used in building construction (43%); electric and electronic products (19%); transportation equipment (19%); consumer and general products (12%); and industrial machinery and equipment (7%).
U.S. mine production increased due to significant increases in production in Arizona, New Mexico and Utah. Copper production at the Bingham Canyon Mine in Utah increased following recovery from a pit-wall failure in 2013, and in May, a 100,000-metric-ton-per-year expansion of copper in concentrate was completed at the Morenci Mine in Arizona.
Total U.S. refined production increased by about 8% owing to across-the-board production increases at electrolytic refineries. In 2015, domestic mining and refined production of copper were expected to increase moderately, and according to International Copper Study Group (ICSG) projections, global refined-copper output was expected to exceed demand owing to lower demand growth in China and a 4.3% growth in global refined production.
World mine production and reserves. Reserves for the United States were revised owing to general reserves depletion and revised estimates for companies that did not report reserves. Reserves for Australia, Canada, Chile, Peru, and Poland were revised based on new information from the governments of those countries. Reserves for Indonesia and Kazakhstan were revised based on reported company data.
Not surprisingly, with the exception of Arizona’s Morenci copper mine, most of the world’s largest copper mines are outside the U.S. Statistica.com has a list of the 10 largest copper mines in the world, ranked by 2013 production in metric tonnes. They are as follows: 1) Escondida (Chile) 1,050 metric tonnes; 2) Grasberg (Indonesia) 790 metric tonnes; 3) Collahuasi (Chile) 520 metric tonnes; 4) Codelco Norte (Chile) 490 metric tonnes; 5) Antamina (Peru) 450 metric tonnes; 6) Morencia (U.S.) 450 metric tonnes; 7) El Teniente (Chile) 443 metric tonnes; 8) Taimyr Peninsula Norilsk/Talnakh Mills (Russia) 430 metric tonnes; 9.) Los Pelambres (Chile) 400 metric tonnes; and 10.) Radomiro Tomic (Chile) 400 metric tonnes.
Events, trends and issues. The COMEX spot copper price began 2014 at $3.36 per pound of copper. The U.S. Geological Survey report said that although fluctuating through several cycles, copper prices on average trended downward during the year in large part owing to reduced demand growth from slower economic growth in China and expectations that the U.S. Federal Reserve would continue cutting its bond purchases during 2014. At the end of August, domestic stocks of refined copper were 22% lower than those at year-end 2013. The ICSG projected that in 2014, global refined copper consumption would exceed production by about 310,000 tons. Global production of refined copper was projected to increase by 2.6% and consumption was projected to increase by 5.2%.
— U.S. Geological Survey

