Latest from Product Sales Potential
EM’s Latest State-Level Product Sales Estimates Pinpoints Market Potential
Electrical Marketing’s updated product sales data can help you analyze revenue potential in several different ways.
Mind share. Electrical Marketing’s average product mix percentages, which were developed from surveys of more than 100 large electrical distributors, tell an interesting story of which products command the most attention, selling time and inventory investment from distributors.
According to EM’s product mix, the 10 product groups that account for the highest percentage of the industry’s total electrical sales are lighting fixtures (16.9%); wire and cable (13.3%); switchgear (8%); industrial controls (6.3%); lamps (5.4%); distribution equipment (5.3%); voice-data-video (VDV) products (3.8%); circuit breakers (3.4%); and conduit fittings and accessories (3.4%). These 10 product groups account for roughly 71% of total industry sales.
Theoretically, every electrical distributor has a distinct product mix tailored to the local market or markets they target. For example, a distributor serving the auto industry in Lansing, MI, is going to have a much higher percentage of industrial products than a distributor in Fort Myers, FL, where the concentration of industrial business is much lighter. But these national percentages will give you a good general idea of which products have the most pull.
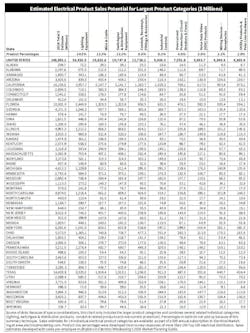
The state-level product sales estimates in the chart below summarize products sales potential for key electrical product groups. You can download all of the product group estimates by clicking on the link below.
The product groups in the downloadable data estimates were the exact ones used on the distributor survey, and EM doesn’t have more detailed product break-outs.


