Latest from Market Sales Estimates
Handful of Metropolitan Areas Will See Bulk of Residential Building in 2023
Building permit activity for 2022 was quite consolidated, with the majority of the activity in the Sunbelt or Intermountain states. The 10 largest markets (see chart on page 3) account for 33% of all single-family building permits, while the Top 25 metros account for more than half the permits. The Top 50 metros account for an estimated 70% of all activity.
Builders in the three Texas markets ranked in the Top 10 pulled a crazy number of combined permits —111,331 single-family permits. The Houston-The Woodlands-Sugar Land, TX, MSA (47,633 permits) led the state’s Big Three, followed by Dallas-Fort Worth, Arlington, TX, MSA (43,409 permits); and Austin-Round Rock-Georgetown, TX, MSA (20,289 permits). Add in San Antonio-New Braunfels, TX, MSA (10,173 permits), and these four metros alone account for more than 121,000 single-family permits. These four Texas MSAs together had more single-family permits than any other entire state except for Florida, which had 133,750 single-family permits for 2022.
Despite the massive number of permits builders pulled in these markets last year, many of the top markets actually experienced some sizeable declines in permit activity. While each of the 10 largest markets saw builders pull at least 12,000 permits through Dec. 2022, nine of these Metropolitan Statistical Areas (MSA) saw year-over-year declines of at least 2,000 permits. It’s interesting to note that the two market areas with year-over-year increases in single-family building permits of more than 1,000 were actually smaller or medium-sized markets — the San Jose-Sunnyvale-Santa Clara, CA, MSA (+1,294 increase) with 3,694 single-family permits, and the Punta Gorda, FL, MSA (+1,202 increase) with 4,637.
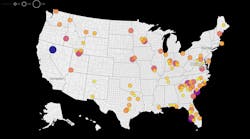
While many of the Sunbelt’s larger MSAs logged some impressive permit totals last year, several smaller and medium-sized markets actually grew faster. You can use the Housing Hotness Index to compare large and small markets in terms of building activity. To level the playing field when comparing smaller market areas to the nation’s largest MSAs, this index ranks metros based on the number of single-family permits per 1,000 residents. It’s interesting to note that seven MSAs in Florida ranked in the Top 10 in the Housing Hotness Index — The Villages; Punta Gorda; North Port-Sarasota-Bradenton; Lakeland-Winter Haven; Cape Coral-Fort Myers; Naples-Marco Island; and Port St. Lucie. Rounding out the Top 10 in the Housing Hotness Index were Austin-Round Rock-Georgetown, TX; Myrtle Beach-Conway-North Myrtle Beach, SC-NC; and Provo-Orem, UT.
Click here to download building permit data for all Metropolitan Statistical Areas


